Sorry, but your login has failed. Please recheck your login information and resubmit. If your subscription has expired, renew here.
January-February 2013
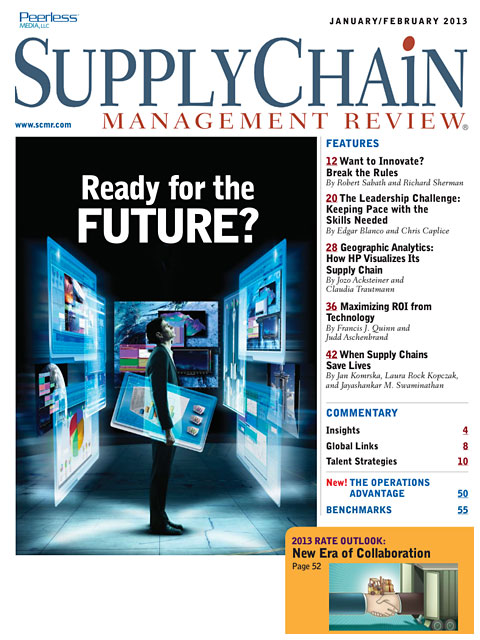
Supply chain management has a host of rules that most managers live by. But in certain cases, say authors Robert Sabath and Rich Sherman, true innovation comes only when those conventional rules are broken. By clearly understanding the nature of the rules and the details of your supply chain, you can know where and when rule-breaking makes sense. Browse this issue archive.Need Help? Contact customer service 847-559-7581 More options
When HP launched its biggest supply chain transformation in history in 2010, it was evident that the challenging multi-billion year-to-year savings targets would be difficult
to reach in the traditional way. This transformation required new approaches to deliver substantial improvements across businesses, targeting cost reductions as well as structural streamlining in the form of partner, network and site consolidations. To meet these challenges, HP had to enhance its analysis toolbox to deliver supply chain projects faster and with better alignment across businesses and regions. (For more on the transformation initiative, see sidebar on “HP’s Transformation Challenge.”)
One of the successful approaches developed to enhance our supply chain analytics capabilities is what we called “Geographic Analytics” (GA), a visualization technique that we describe more fully below. GA works. It reduced the time required for network optimization projects by up to 50 percent. In addition, projects driven by this approach were often better supported by the business groups. The reason: Executives became involved much earlier than they would have in traditional, purely data-driven supply chain analysis work.
Although designed to support supply chain network optimization, Geographic Analytics has applications far beyond its original purpose. We received major interest in this technique from groups both inside and outside of HP, including from sales and after-sales organizations, enterprise risk management functions, and from supplier relationship managers. Each of these groups has a regular need for visualizing and analyzing location data for a variety of purposes ranging from studying after-sales networks to risk management of the supplier base.
 |
This complete article is available to subscribers
only. Click on Log In Now at the top of this article for full access. Or, Start your PLUS+ subscription for instant access. |
Not ready to subscribe, but need this article?
Buy the complete article now. Only $20.00. Instant PDF Download.
Access the complete issue of Supply Chain Management Review magazine featuring
this article including every word, chart and table exactly as it appeared in the magazine.
SC
MR
Sorry, but your login has failed. Please recheck your login information and resubmit. If your subscription has expired, renew here.
January-February 2013
Supply chain management has a host of rules that most managers live by. But in certain cases, say authors Robert Sabath and Rich Sherman, true innovation comes only when those conventional rules are broken. By clearly… Browse this issue archive. Access your online digital edition. Download a PDF file of the January-February 2013 issue.|
|
Download Article PDF |
When HP launched its biggest supply chain transformation in history in 2010, it was evident that the challenging multi-billion year-to-year savings targets would be difficult to reach in the traditional way. This transformation required new approaches to deliver substantial improvements across businesses, targeting cost reductions as well as structural streamlining in the form of partner, network and site consolidations. To meet these challenges, HP had to enhance its analysis toolbox to deliver supply chain projects faster and with better alignment across businesses and regions. (For more on the transformation initiative, see sidebar on “HP’s Transformation Challenge.”)
One of the successful approaches developed to enhance our supply chain analytics capabilities is what we called “Geographic Analytics” (GA), a visualization technique that we describe more fully below. GA works. It reduced the time required for network optimization projects by up to 50 percent. In addition, projects driven by this approach were often better supported by the business groups. The reason: Executives became involved much earlier than they would have in traditional, purely data-driven supply chain analysis work.
Although designed to support supply chain network optimization, Geographic Analytics has applications far beyond its original purpose. We received major interest in this technique from groups both inside and outside of HP, including from sales and after-sales organizations, enterprise risk management functions, and from supplier relationship managers. Each of these groups has a regular need for visualizing and analyzing location data for a variety of purposes ranging from studying after-sales networks to risk management of the supplier base.
|
|
SUBSCRIBERS: Click here to download PDF of the full article. |
SC
MR

Latest Supply Chain News
- PepsiCo moves its startup sustainability program from pilots to operational scale across Asia Pacific
- Eli Lilly’s Mar Gimeno to keynote at NextGen Supply Chain Conference 2026
- Agentic coding and the future of supply chain leadership
- From orbit to operations: Winning the race for the earliest disruption signal
- Stop moving boxes, start moving dollars: The new math of global supply chain velocity
- More News
Latest Podcast

 Explore
Topics
Latest Supply Chain News
- PepsiCo moves its startup sustainability program from pilots to operational scale across Asia Pacific
- Eli Lilly’s Mar Gimeno to keynote at NextGen Supply Chain Conference 2026
- Agentic coding and the future of supply chain leadership
- From orbit to operations: Winning the race for the earliest disruption signal
- Stop moving boxes, start moving dollars: The new math of global supply chain velocity
- Finding your rhythm: SME supply chain footwork when the rules keep changing
- More latest news
Latest Resources
Subscribe
Supply Chain Management Review delivers the best industry content.

Editors’ Picks